Dashboard
Overview
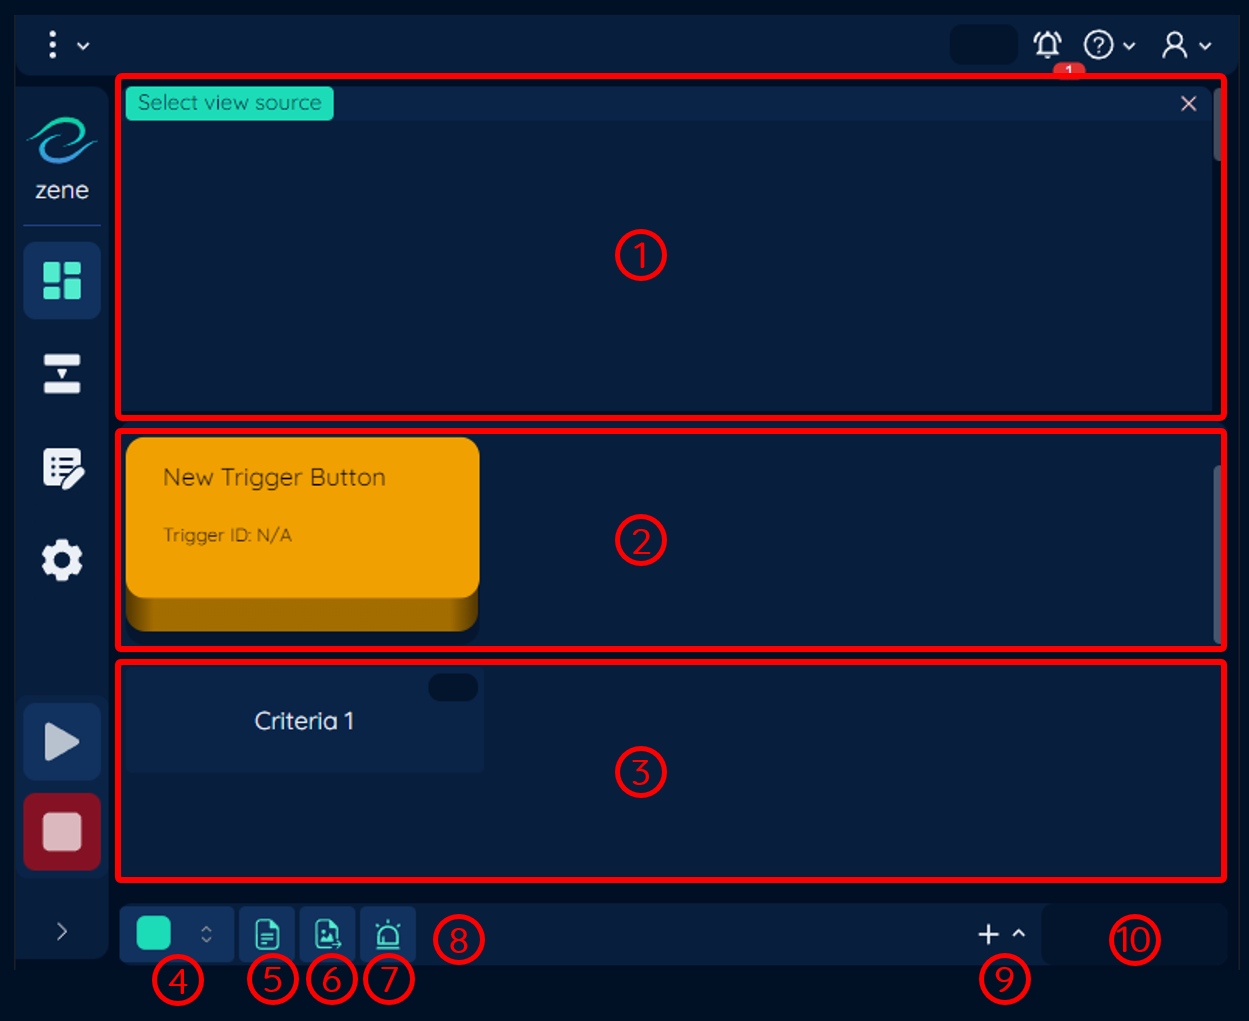
The dashboard is the main interface of Zene. It is where the user can view the frames, trigger the flow, and view the status of the criteria.
The dashboard layout is dynamic and will change depending on the width of the window. On some areas, the user can click and drag to resize the area.
1: Frame View Area
This is the area where the frames are displayed.
See Frame View for more information.
2: Trigger Button Area
See Trigger Button Area for more information.
See Input Trigger Tool for more information about the trigger tool.
3: Criteria Condition Status Area
This is the area where the criteria condition status is displayed. The status boxes are displayed in the order of the condition specified in the criteria.
See Criteria for more information.
Depending on the width of the view area, the status boxes will be displayed either below the frame view area or to the right of the frame view area.
The criteria condition status is only available when the criteria are enabled.
4: Frame View Column
Click to select the frame view column. Columns are position from left to right in the order they are created. The user can select the number of column from 1 to 5.
See Frame View Layout for more information.
5: Export Text Master Toggle
Click to toggle the Export Text tool. This acts as a master toggle for all Export Text tools in the flow. If the toggle is off, all Export Text tools will be disabled.
6: Export Image Master Toggle
Click to toggle the Export Image tool. This acts as a master toggle for all Export Image tools in the flow. If the toggle is off, all Export Image tools will be disabled.
7: Pop-up Alert Master Toggle
Click to toggle the Pop-up Alert tool. This acts as a master toggle for all Pop-up Alert tools in the flow. If the toggle is off, all Pop-up Alert tools will be disabled.
The master toggle is only available for Export Text, Export Image, and Pop-up Alert tools.
Use the master toggle to quickly disable all Export Text, Export Image, and Pop-up Alert tools in the flow.
8: Server Status Information
This is a "pop-over" that displays the server status information. The information includes:
- Flow time: The time it takes for the one (1) flow to run. See Flow Time for more information.
- Camera Temperature: The temperature of the camera that has temperature information.
- Camera Temperature Status: The status of the camera temperature. The status can be one of the following:
Normal: The temperature is normal.Warning: The temperature is higher than the warning threshold.Critical: The temperature is higher than the critical threshold.
9: Add to Dashboard Menu Button
Click to open the Add to Dashboard menu. The menu contains the following items:
- Add trigger button:
Add a trigger button to the dashboard. - Add frame view:
Add a frame view to the dashboard.
10: Criteria Status
The criteria status indicator shows the current status of the criteria. The indicator can be one of the following:
Pass: The criteria is met.Failed: The criteria is not met.
See Criteria - Statuses for more details.
The criteria status indicator is only available when the criteria is enabled.
Trigger Button Area
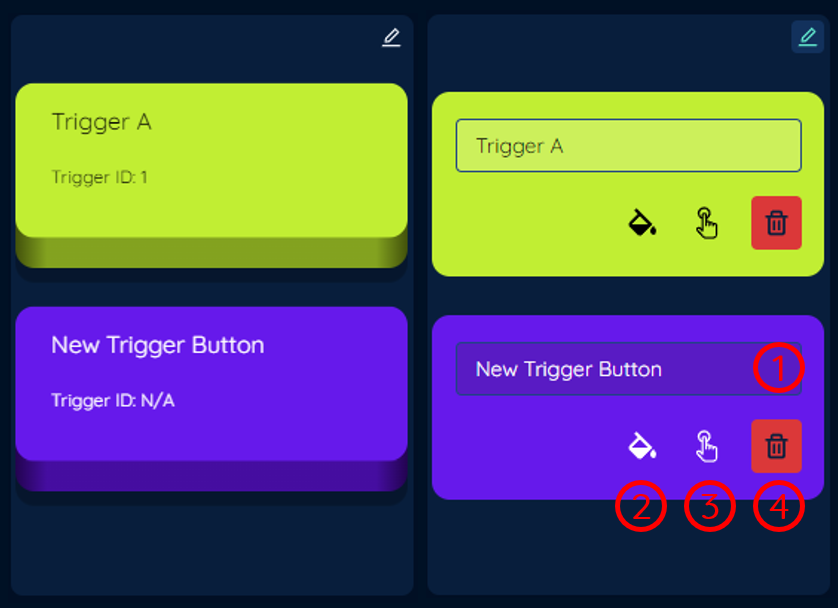
This area is where the trigger buttons are located. The trigger buttons are one of the four (4) types of trigger available in the Trigger Tool. The trigger buttons are displayed in the order of creation.
The image above shows the trigger buttons in normal mode (left) and edit mode (right). The trigger buttons are in normal mode by default. The user can click on the Edit button, located at the top right of the area to enter edit mode.
In edit mode, the user can:
-
Rename:
Click on the trigger button name to rename the trigger button. -
Change the colour:
Click on the colour picker to change the colour of the trigger button. -
Link to a tool:
Click on the button to link the trigger button to an input trigger tool. The user can select the Input trigger tool from the drop-down list. -
Delete: Click on the
Deletebutton to delete the trigger button.
For more details on the Trigger Tool, see Input Trigger Tool.